Introduction
Our customer wanted to show statistics on shop's visitors, usages of escalators, elevators and passages on maps of malls and shopping centers. There was a need to mark such maps with points where to show numbers and define which statistics to show exactly. And, of course, statistics should be calculated and shown for the selected period and filter. Data source, its calculation and storing are separate areas and are not included in this article.
One might say "It's a piece of cake—just take vector map of the mall in svg format and add any custom data’. Modern, fast and pretty. Existing solutions like jVectorMap provide such functionality.
There is one huge BUT. Maps are scalar images instead of vector. Furthermore, they are provided by mall's owners and have completely different styles and content. Amount of malls (about 300) doesn't allow to redraw them in vectors in a fast and cheap way. Besides, adding new malls will cause more work and money to be spent.
That is why we've decided to use HTML5 canvas for both marking a map and displaying statistical data.
Choosing a framework
It is not easy and comfortable to work with canvas API directly but there are a bunch of frameworks for simplifying developer's life while working with canvas. Requirements for a framework in our case:
- Object model on top of canvas element
- Ability to draw and scale an image
- Interactivity: ability to manipulate objects while marking a map; ability to zoom a map and shift it
- Ability to export/import marked objects
- Detailed event system
- Good performance for big number of objects
Suitable frameworks which we considered are: fabric.js, EaselJS, Raphaël, Paper.js and Processing.js.
Fabric.js satisfies all our requirements and, taking into account some experience with it, was chosen as a basis. In the examples below we use version 1.4.4.
Canvas and map
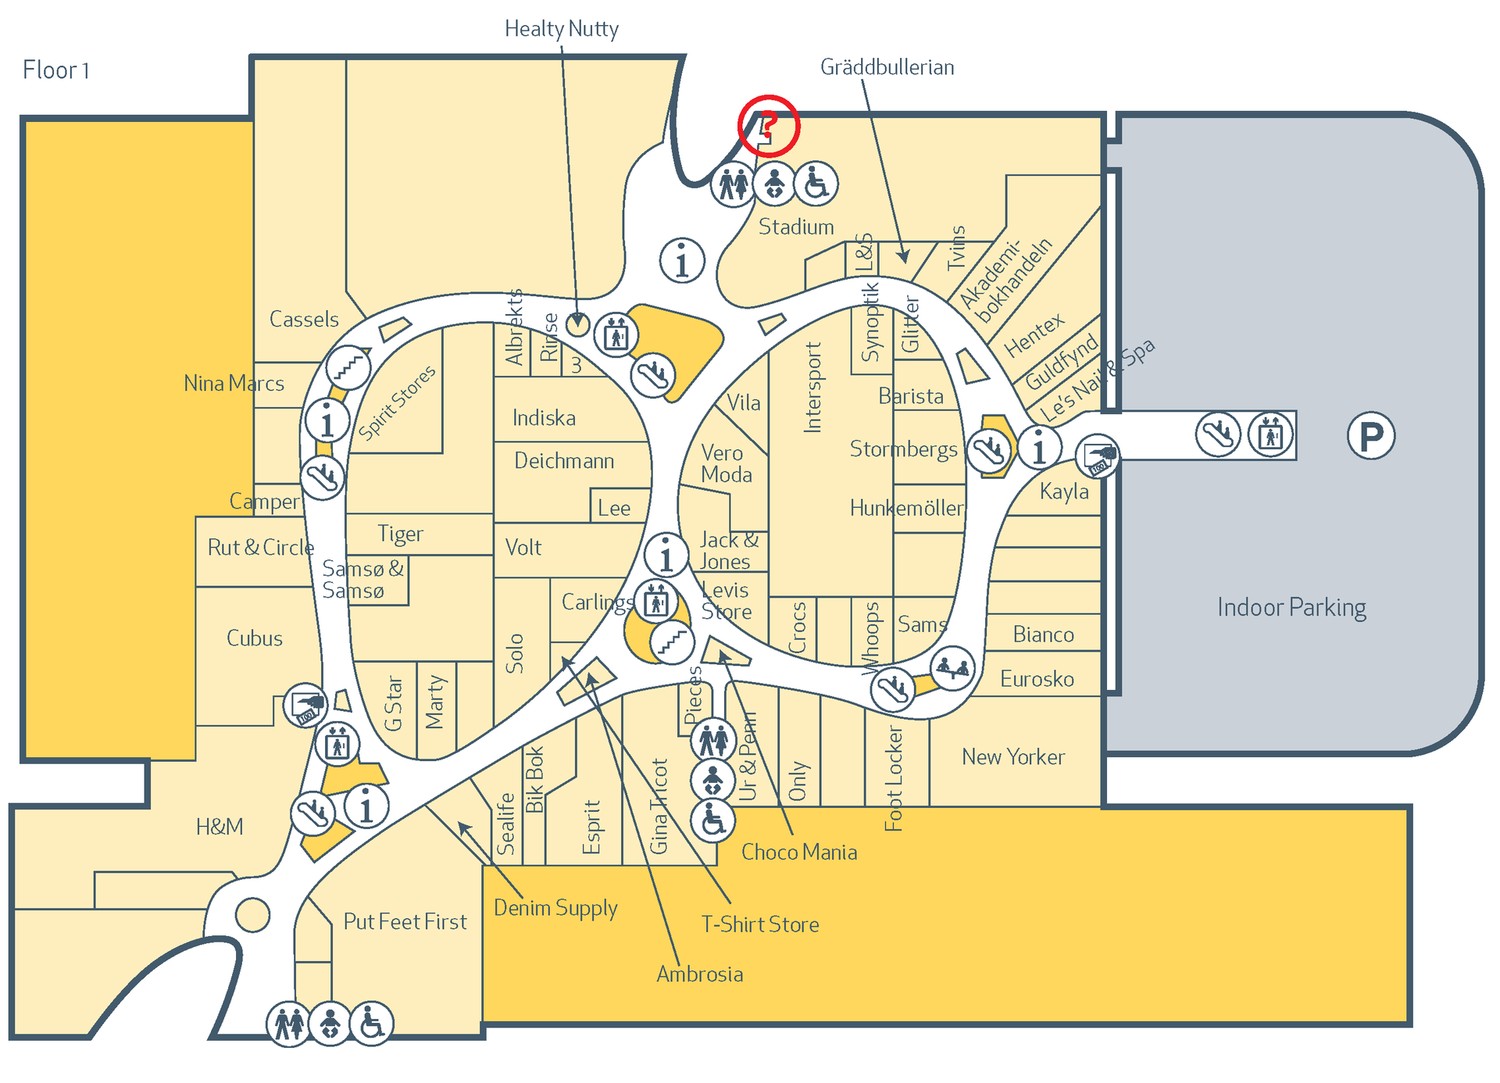
Let's take an ordinary mall's map:
We can create simple canvas in the markup of the page:
<canvas id="canvas"width="1000px" height="400px" style="border: 1px solid black">
Now let's make fabric.js canvas with proper settings on the top of the HTML5 canvas:
 var element = $('#canvas'), // we are going to use it for event handling
canvas = new fabric.Canvas(element.get(0), {
        selection: false, // disable groups selection
        scale: 1, // set default scale
	renderOnAddRemove: false, // disable auto-render in order to improve performance for complex maps with a lot of markers
	moveCursor: 'default', // reset mouse cursor—they are not used by us
	hoverCursor: 'default'
});
Scaling and shifting a map
A map can have any dimensions. That is why we need to give user a way to zoom it and shift current visible area using a mouse. In fact, such manipulations are transformations of all objects on the map i.e. changing of size and position.
That is why we have to remember initial (base) and current states:
var baseWidth = 0,
    baseHeight= 0,
    baseScale = 1,
    width = 0, // current width
    height = 0, // current height
    transX = 0, // current shift for x axis
    transY = 0, // current shift for y axis
    scale = 1; // current global scale
This is how we apply transform on objects:
var applyTransform = function () {
    var maxTransX,
        maxTransY,
        minTransX,
        minTransY,
        group;

    // Calculation of thresholds for x axis transition
    if (baseWidth * scale <= width) {
        // Map fits into the canvas
        maxTransX = (width - baseWidth * scale) / (2 * scale);
        minTransX = (width - baseWidth * scale) / (2 * scale);
    } else {
        // Map doesn’t fit
        maxTransX = 0;
        minTransX = (width - baseWidth * scale) / scale;
    }

    // Limit transition with calculated thresholds
    if (transX > maxTransX) {
        transX = maxTransX;
    } else if (transX < minTransX) {
        transX = minTransX;
    }

    // The same for y axis
    if (baseHeight * scale <= height) {
        maxTransY = (height - baseHeight * scale) / (2 * scale);
        minTransY = (height - baseHeight * scale) / (2 * scale);
    } else {
        maxTransY = 0;
        minTransY = (height - baseHeight * scale) / scale;
    }
    if (transY > maxTransY) {
        transY = maxTransY;
    } else if (transY < minTransY) {
        transY = minTransY;
    }

    // Group all objects and apply transform on the group
    group = new fabric.Group(canvas.getObjects());
    group.scaleX = scale / canvas.scale;
    group.scaleY = scale / canvas.scale;
    group.left = group.getWidth() / 2 + transX * scale;
    group.top = group.getHeight() / 2 + transY * scale;
    group.destroy();

    // Refresh global scale for the canvas
    canvas.scale = scale;

    // At last render canvas with changed objects
    canvas.renderAll();
};
Separate function controls and applies zoom:
var setScale = function (scaleToSet, anchorX, anchorY) {
    var zoomMax = 5, // max 5x zoom
        zoomMin =  1, // min 1x zoom—real image size
        zoomStep; // required scale change

    // Limit scale if needed
    if (scaleToSet > zoomMax * baseScale) {
        scaleToSet = zoomMax * baseScale;
    } else if (scaleToSet < zoomMin * baseScale) {
        scaleToSet = zoomMin * baseScale;
    }

    // The center of zoom—a point which should stay on its place.
    // It is defined by anchorX and anchorY arguments.
    // In fact, it is just a position of mouse pointer during scaling.
    if (typeof anchorX != 'undefined' && typeof anchorY != 'undefined') {
        zoomStep = scaleToSet / scale;
        // Calculate required shift for all objects
        // so the center of zoom stays motionless.
        transX -= (zoomStep - 1) / scaleToSet * anchorX;
        transY -= (zoomStep - 1) / scaleToSet * anchorY;
    }

    scale = scaleToSet;
    applyTransform();
};
The only thing left is subscription on mouse events:
var bindContainerEvents= function () {
    var mouseDown = false,
        oldPageX,
        oldPageY,
        container = $(canvas.wrapperEl);

    container.mousemove(function (e) {
        // Shifting
        if (mouseDown) {
            // Calculate transition with respect to the current scale
            transX -= (oldPageX - e.pageX) / scale;
            transY -= (oldPageY - e.pageY) / scale;

            applyTransform();

            oldPageX = e.pageX;
            oldPageY = e.pageY;
            return false;
        }
    }).mousedown(function (e) {
        // Store position
        mouseDown = true;
        oldPageX = e.pageX;
        oldPageY = e.pageY;
        return false;
    });

    $('body').mouseup(function () {
        mouseDown = false;
    });

    // Zoom with mouse wheel
    container.mousewheel(function (event, delta, deltaX, deltaY) {
        var offset = element.offset(), // position of the canvas on the page
            centerX = event.pageX - offset.left, // x coordinate of the center of zoom
            centerY = event.pageY - offset.top, // y coordinate of the center of zoom
            zoomStep = Math.pow(1.3, deltaY); // user-friendly zoom step

        setScale(scale * zoomStep, centerX, centerY);

        // Prevent scroll of the page
        event.preventDefault();
    });
};
Here we use jQuery Mousewheel for mouse wheel event handling.
In addition, we have separate logic for handling events on touch devices. So client can use ordinary habitual multi-touch patterns—move (one finger touch), zoom in and out (two fingers touch).
var bindContainerTouchEvents = function () {
    var touchStartScale,
        touchStartDistance,
        container = $(canvas.wrapperEl),
        touchX,
        touchY,
        centerTouchX,
        centerTouchY,
        lastTouchesLength,
        handleTouchEvent = function (e) {
            var touches = e.originalEvent.touches,
                offset,
                currentScale,
                transXOld,
                transYOld;

            if (e.type == 'touchstart') {
                lastTouchesLength = 0;
            }
            if (touches.length == 1) {
                // Simple shift
                if (lastTouchesLength == 1) {
                    transXOld = transX;
                    transYOld = transY;
                    transX -= (touchX - touches[0].pageX) / scale;
                    transY -= (touchY - touches[0].pageY) / scale;
                    applyTransform();
                    if (transXOld != transX || transYOld != transY) {
                        e.preventDefault();
                    }
                }
                touchX = touches[0].pageX;
                touchY = touches[0].pageY;
            } else if (touches.length == 2) {
                // Zoom
                if (lastTouchesLength == 2) {
                    currentScale = Math.sqrt(
                     Math.pow(touches[0].pageX - touches[1].pageX, 2) +
                     Math.pow(touches[0].pageY - touches[1].pageY, 2)
                    ) / touchStartDistance;
                    setScale(touchStartScale * currentScale, centerTouchX, centerTouchY);
                    e.preventDefault();
                } else {
                    // This is zoom start, store current state
                    offset = element.offset();
                    if (touches[0].pageX > touches[1].pageX) {
                        centerTouchX = touches[1].pageX + (touches[0].pageX - touches[1].pageX) / 2;
                    } else {
                        centerTouchX = touches[0].pageX + (touches[1].pageX - touches[0].pageX) / 2;
                    }
                    if (touches[0].pageY > touches[1].pageY) {
                        centerTouchY = touches[1].pageY + (touches[0].pageY - touches[1].pageY) / 2;
                    } else {
                        centerTouchY = touches[0].pageY + (touches[1].pageY - touches[0].pageY) / 2;
                    }
                    centerTouchX -= offset.left;
                    centerTouchY -= offset.top;
                    touchStartScale = scale;
                    touchStartDistance = Math.sqrt(
                     Math.pow(touches[0].pageX - touches[1].pageX, 2) +
                     Math.pow(touches[0].pageY - touches[1].pageY, 2)
                    );
                }
            }

            lastTouchesLength = touches.length;
        };

    container.bind('touchstart', handleTouchEvent);
    container.bind('touchmove', handleTouchEvent);
};
All transformation magic and events handling has been taken from jVector.
fabric.util.loadImage('Map.png', function(img) {
    var map = new fabric.Image(img),
        curBaseScale;
    if (('ontouchstart' in window) || (window.DocumentTouch && document instanceof DocumentTouch)) {
        bindContainerTouchEvents();
    } else {
        bindContainerEvents();
    }

    // Set base and current dimensions
    baseWidth = map.width;
    baseHeight = map.height;
    width = element.width();
    height = element.height();

    // Disable all edit and object selecting functionality on the canvas
    map.set({
        hasRotatingPoint: false,
        hasBorders: false,
        hasControls: false,
        lockScalingY: true,
        lockScalingX: true,
        selectable: false,
        left: map.width / 2,
        top: map.height / 2,
        originX: 'center',
        originY: 'center'
    });
    canvas.add(map);

    // Zoom after load in order to show whole map from the beginning
    curBaseScale  = baseScale;
    if (width / height > baseWidth / baseHeight) {
        baseScale = height / baseHeight;
    } else {
        baseScale = width / baseWidth;
    }
    scale *= baseScale / curBaseScale;
    transX *= baseScale / curBaseScale;
    transY *= baseScale / curBaseScale;

    canvas.setWidth(width);
    canvas.setHeight(height);

    applyTransform();

    // Show markers on the map, will be added later
    createMarkers();
});
Markers
We already have usable map. Next step is making possible to create markers on it and show with statistical data. Vector object are the most suitable choice since they look pretty for any zoom rate.
We also need to add a text for the marker. It shows visitors statistics for the particular point of the map. Such text is readable on any map if we wrap it with simple rectangle with solid fill. It is necessary to set originX and originY to 'center' in order to place text and wrapper correctly relative to each other.
var markerColor = '#2567d5';

var addMarker = function(point, text) {
    // Marker itself
    var marker = new fabric.Path('m 11,-19.124715 c -8.2234742,0 -14.8981027,-6.676138 -14.8981027,-14.9016 0,-5.633585 3.35732837,-10.582599 6.3104192,-14.933175 C 4.5507896,-52.109948 9.1631953,-59.34619 11,-61.92345 c 1.733396,2.518329 6.760904,9.975806 8.874266,13.22971 3.050966,4.697513 6.023837,8.647788 6.023837,14.667425 0,8.225462 -6.674629,14.9016 -14.898103,14.9016 z m 0,-9.996913 c 2.703016,0 4.903568,-2.201022 4.903568,-4.904687 0,-2.703664 -2.200552,-4.873493 -4.903568,-4.873493 -2.7030165,0 -4.903568,2.169829 -4.903568,4.873493 0,2.703665 2.2005515,4.904687 4.903568,4.904687 z"',
    {
        width: 40,
        height: 80,
        scaleX: scale,
        scaleY: scale,
        left: point.x,
        top: point.y,
        originX: 'center',
        originY: 'center',
        fill: markerColor,
        stroke: '#2e69b6',
        text: text // save text inside the marker for import/export
    }),
    // Text
    textObject = new fabric.Text(text, {
        fontSize: 30,
        originX: 'center',
        fill: markerColor,
        originY: 'center'
    }),
    // Wrapper
    background = new fabric.Rect({
        width: 100,
        height: 40,
        originX: 'center',
        originY: 'center',
        fill: 'white',
        stroke: 'black'
    }),
    // Group for correct positioning
    textGroup = new fabric.Group([background, textObject], {
        scaleX: scale,
        scaleY: scale,
        left: point.x + 20 * scale, // respect current scale
        top: point.y - 30 * scale // respect current scale
    });

    canvas.add(marker);
    canvas.add(textGroup);
};
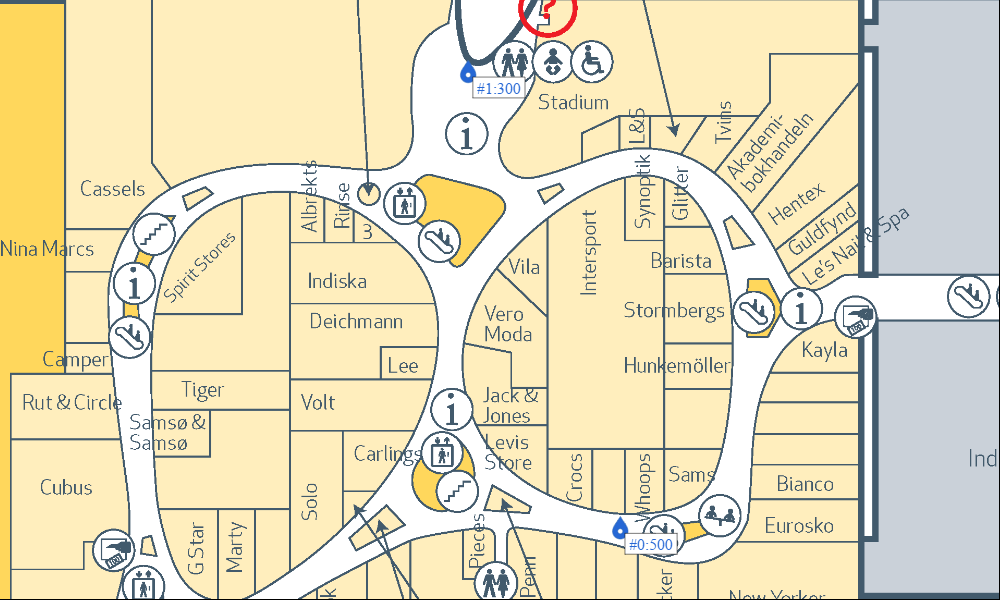
Now it is very easy to add any marker:
    addMarker({x: 550, y: 390}, '#0:500');
    addMarker({x: 460, y: 120}, '#1:300');
    canvas.renderAll();
Here is the result:
Editing
Let’s introduce edit mode—each click on the map creates new marker. It is sufficient to have simple checkbox and flag:
<div><input type="checkbox" onclick="window.isEditing = this.checked" id="editing"/><label for="editing">Editing</label></div>
var createMarkers = function() {
    var markersCount = 0;

    // Flag for edit mode
    window.isEditing = false;

    // Create new marker
    canvas.on('mouse:down', function (options) {
        var position;

        if (!window.isEditing) {
            return;
        }
        // Get absolute position on the canvas
        position = canvas.getPointer(options.e);
        // Text is a composition of order number and random number
        addMarker(position, '#' + markersCount++ + ':' + Math.round(Math.random() * 1000));
        // Don’t forget to re-draw the canvas!
        canvas.renderAll();
    });
};
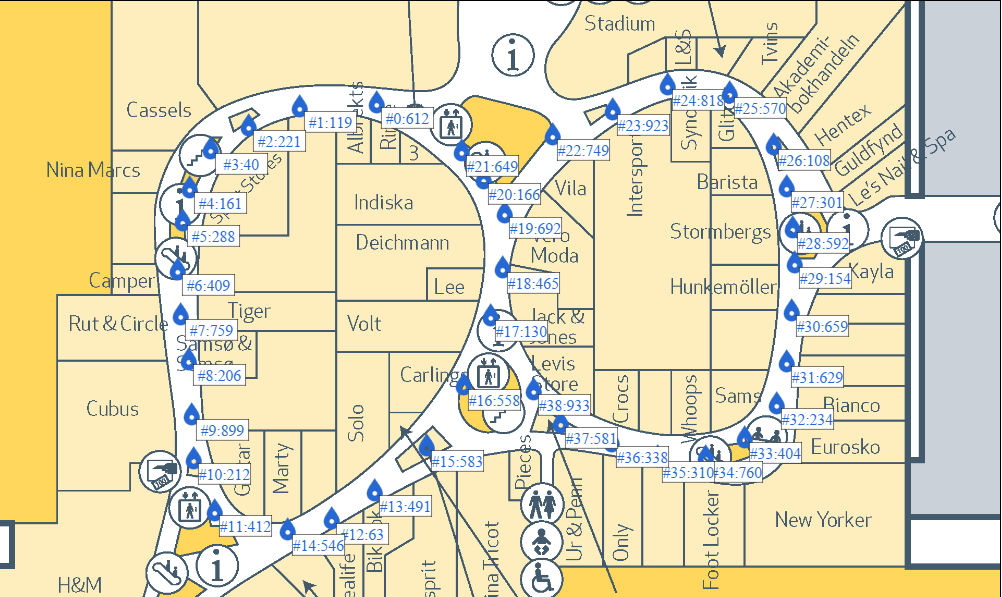
It is possible now to turn the map into a piece of art or a mash of markers:
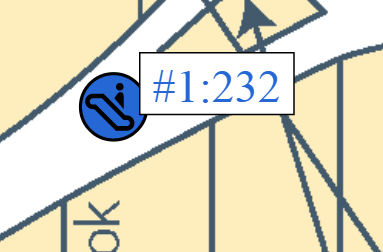
Of course, it is easy to give user ability to choose marker color and shape, related information etc. For instance, escalator sign could act as a marker:
var circle = new fabric.Circle({ radius: 22.5 }),
    path1 = new fabric.Path('M31,31h-2L15,17H9c-1.1027832,0-2,0.8971558-2,2c0,1.1027832,0.8972168,2,2,2h2l14,14h6c1.1027832,0,2-0.8972168,2-2C33,31.8971558,32.1027832,31,31,31z', { originX: 'center', originY: 'center', fill: markerColor }),
    path2 = new fabric.Path('M22.5,2C11.1782227,2,2,11.1781616,2,22.5S11.1782227,43,22.5,43S43,33.8218384,43,22.5S33.8217773,2,22.5,2z M26.5,7C27.8806152,7,29,8.1192627,29,9.5c0,1.3806763-1.1193848,2.5-2.5,2.5c-1.3807373,0-2.5-1.1193237-2.5-2.5C24,8.1192627,25.1192627,7,26.5,7z M26.5,13.0023804c1.380249-0.0330811,2.5,0.2385864,2.5,3s0,8,0,8l-6-7C23,17.0023804,25.0908203,13.0361938,26.5,13.0023804z M31,38h-7L10,24H9c-2.7614746,0-5-2.2385864-5-5s2.2385254-5,5-5h7l14,14h1c2.7613525,0,5,2.2385864,5,5S33.7613525,38,31,38z', { originX: 'center', originY: 'center', fill: markerColor }),
    marker = new fabric.Group([circle, path1, path2], {
        width: 40,
        height: 80,
        scaleX: scale,
        scaleY: scale,
        left: point.x,
        top: point.y,
        originX: 'center',
        originY: 'center',
        fill: markerColor,
    });
Furthermore, fabric.js allows to edit objects—move, resize, rotate etc. So user gets wide opportunities to create good looking map suitable for the analysis.
Zones
The customer also wanted to highlight zones on the map and show statistics for these zones. We've decided to use simple polygon with custom number of points which user marks with mouse clicks. Such polygon is always closed and is easy applied on the map. Double click can signal the end of the marking process. It is also good to use ‘backspace’ and ‘delete’ buttons to undo last action in case of misstep.
Then adding a zone can be done this way:
canvas.on('mouse:down', function (options) {
        addExtendZone(options.e);
    }).on('mouse:move', function (options) {
        drawZone(options.e);
    });
    $(document).on('dblclick', finishZone).on('keydown', undoZonePoint);

// Helper function to get position with respect to the current scale
var convertPointToRelative = function(point, object) {
    return { x: (point.x - object.left) / scale, y: (point.y - object.top) / scale };
};

var addExtendZone = function(mouseEvent) {
    var position = canvas.getPointer(mouseEvent);

    // New point (corner) of the polygon
    if (currentEditingZone) {
        currentEditingZone.points.push(convertPointToRelative(position, currentEditingZone));
        return;
    }
    // New zone—let’s create 3 points so zone is displayed as a thin line
    currentEditingZone = new fabric.Polygon(
        [{ x: 0, y: 0 }, { x: 1, y: 1 }, { x: -1, y: -1 }], {
        scaleX: scale,
        scaleY: scale,
        left: position.x,
        top: position.y,
        fill: new fabric.Color(markerColor).setAlpha(0.3).toRgba(),
        stroke: '#2e69b6',
    });

    canvas.add(currentEditingZone);
    canvas.renderAll();
};

var drawZone =  function(mouseEvent) {
    var points;
    if (currentEditingZone) {
        // Change last point following the mouse pointer
        points = currentEditingZone.points;
        points[points.length - 1] = convertPointToRelative(canvas.getPointer(mouseEvent), currentEditingZone);
        canvas.renderAll();
    }
};

var finishZone = function () {
    if (!currentEditingZone) {
        return;
    }

    // Remove last point finishing the zone
    currentEditingZone.points.pop();
    currentEditingZone = null;
};

var undoZonePoint = function(event) {
    // Handle only backspace and delete
    if (currentEditingZone && (event.which == 8 || event.which == 46)) {
        var points = currentEditingZone.points,
            isDeleted = points.length <= 3;
        points[points.length - 2] = points[points.length - 1];
        points.pop();
        // Cancel creating new zone
        if (isDeleted) {
            canvas.remove(currentEditingZone);
            currentEditingZone = null;
        }
        canvas.renderAll();
        event.preventDefault();
    }
};
Result
By bringing everything together we gave the customer an ability to put markers and zones on any mall’s map, import and export markers and draw with statistics on visitors of the areas or spots on a map. Like this:
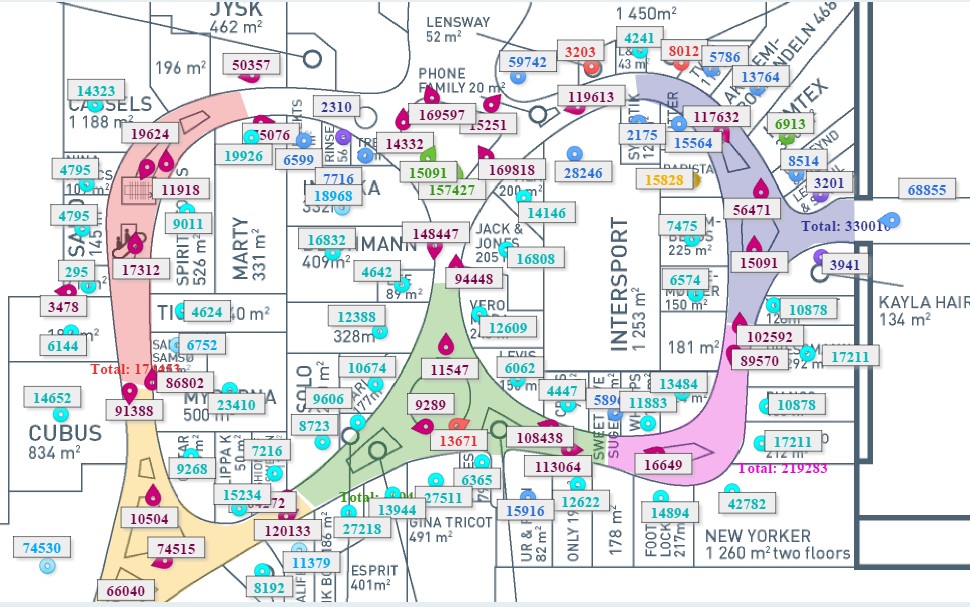
Thus, a variety and functionality of modern technologies and frameworks allows to visualize data in a user-friendly and flexible way with minimum effort and time. HTML5 canvas and fabric.js provide tools for easy developing fast and interactive systems.